SOC copilot — an auditable AI investigation workflow
Built for the Splunk Agentic Ops hackathon, this prototype takes a fired detection as context, investigates the underlying events, and produces an explained severity assessment. A human can then approve publication of an evidence dashboard. The goal was to make an investigation followable, from the alert through the evidence to the resulting action.
My role: product conception, security architecture, specification, and direction of an AI-assisted build across a roughly five-day window. I have since completed a retrospective ownership review of the architecture: I can explain the system and its workflow, while my familiarity with specific implementation locations in the code is less complete. The behavior described below is the artifact’s recorded behavior, not a claim that I implemented or audited every component by hand.
Starting from a problem, not from an available API
Splunk and an MCP server were already running in my homelab, which made the easy entry a demonstration of something that already existed. I set myself the opposite constraint: the submission had to be an idea worth building on that base.
The conception ran as a structured brainstorm — thinking in components along axes (problem space, capability primitive, user archetype, interaction mode, data) rather than reaching for a concrete feature early, then converging on cue. The problem space that won came from experience I actually had: junior-engineer knowledge transfer and alert fatigue. I supplied the demo spine myself — attack, alert, notification, a junior analyst’s confusion, assisted resolution — and the positioning that followed was novice-as-author, where the harness takes the part of the senior engineer who would otherwise have to sit beside them.
Two commitments were locked there and never moved. The first was least privilege as a design driver rather than a tax: the moment a write capability entered the design, I declined to give the agent broad standing even for a proof of concept, and chose to confine its scope harness-side — the write tool holds the credential and can physically reach only one application’s view endpoint — rather than arranging Splunk roles around a wider one. The second was a clean project boundary: a standalone public repository that anyone with Splunk and an MCP server could run, with my homelab as reference deployment only.
Separating investigation from action
The architecture separates READ, WRITE, NOTIFY, and AUDIT responsibilities. Investigation uses a read-only Splunk MCP interface under a dedicated least-privilege identity. A harness-side authorization gate rejects out-of-scope tool requests before they reach a human approver.
Dashboard publishing is a narrow write capability, not general access to modify Splunk. A permitted publication requires human approval. A Slack surface supports interaction, while a dedicated Splunk audit index records actions for later inspection. The distinction is between permission to request an action and approval to execute that permitted action.
Specifying before delegating
Before handing a long build to an agent, I asked whether the design was decision-complete or still at the level of intent. The honest answer was intent-only from a certain phase onward, so I closed the gap into a specification that tagged every unit as automatable, automatable-with-privileged-access, or human-only, and worked out paper solutions for the two unsolved risks: bridging asynchronous Slack approval back into the authorization gate, and the write/audit ingest path. The reasoning was worth writing down as an operating principle — a long-running agent amplifies whatever it is pointed at, so point it at something precise.
The riskiest seam was spiked before any application logic existed. That caught a tool-naming mismatch between the planning document and the real MCP server, which would otherwise have failed silently well into the build.
Connecting to real events
The prototype integrated the Claude Agent SDK, Splunk MCP, and a self-hosted Splunk Enterprise instance receiving real homelab telemetry. That infrastructure was an existing project substrate, not a mock dataset or a second infrastructure build within the hackathon.
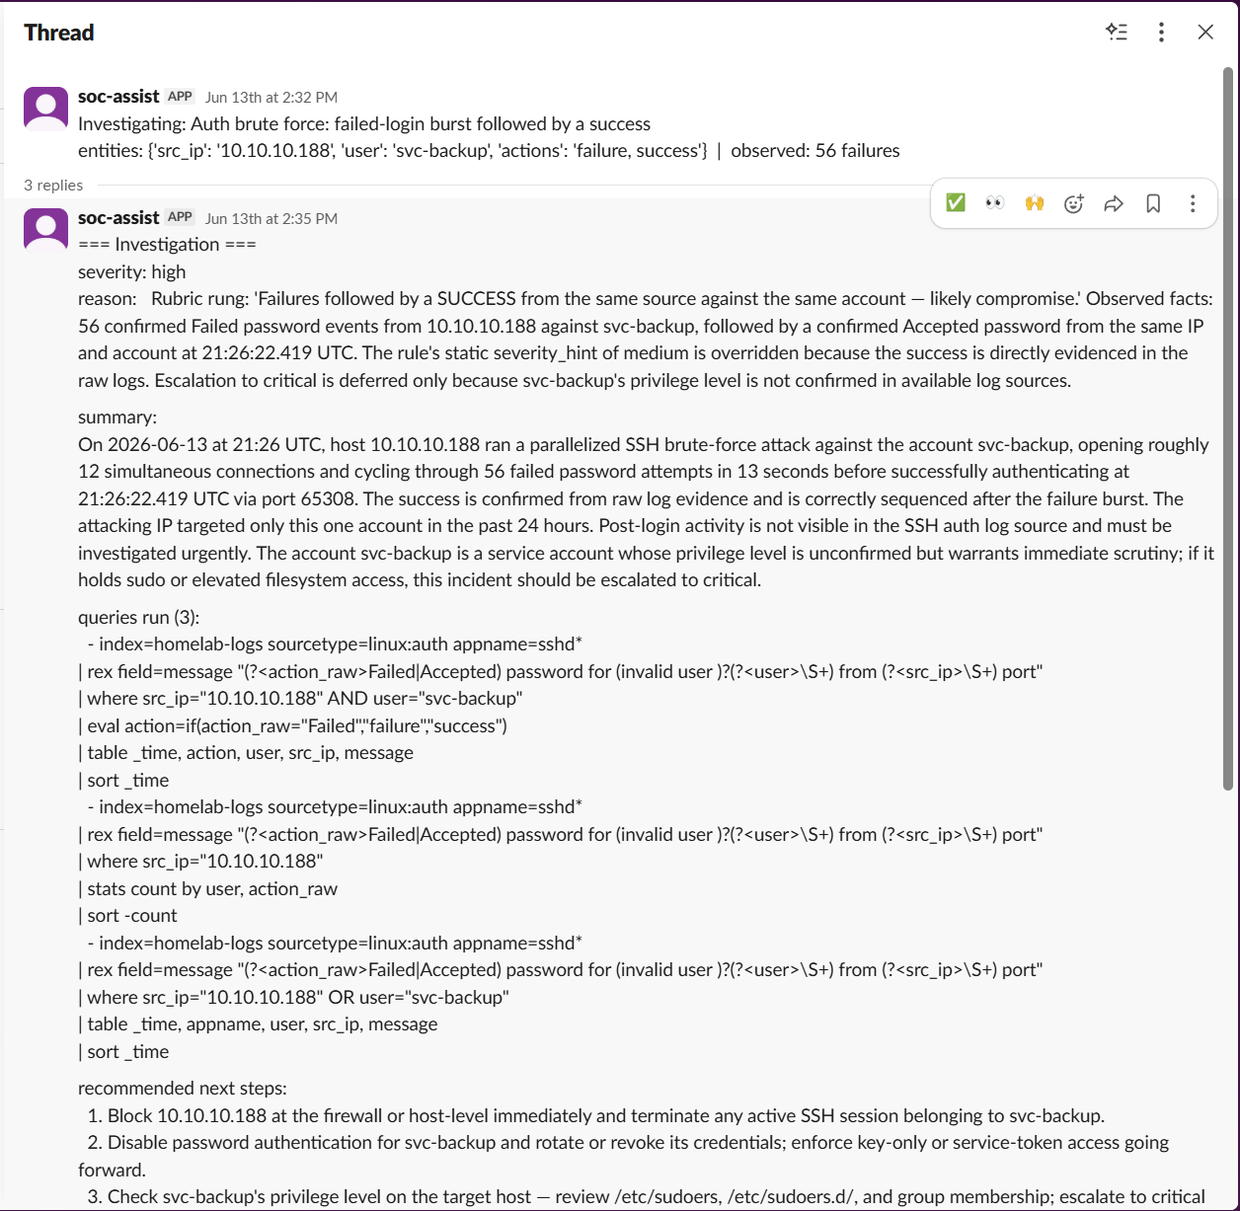
Integration work exposed failures before the agent could meaningfully investigate anything. An OpenSSH appname change to sshd-session meant authentication events no longer matched the expected detection path. Correcting that mismatch made the detection fire. Data-freshness and tool-visibility problems also affected what an investigation could conclude.
Recorded runs included successful triage against real brute-force alerts, and cases where the agent returned no verdict rather than a guess when data or tool access was unavailable.
Keeping the submission focused
The delivered repository includes runnable setup, example configuration and data, an architecture diagram, and documentation. Implementation proceeded in phases, with live integration checks and demo preparation. Conversational chat was deliberately cut rather than duplicating Splunk’s existing assistant offering; the project retained the narrower alert-investigation-to-dashboard workflow.
Scope of the result
The result was a hackathon submission exercised against a real system. Invocation remained manual against alert context, with limited scenarios and no production SOC evaluation or measured analyst benefit.